Maximize Your Tableau Investment
If you wish to exploit all the benefits of Tableau, our data scientists and dashboard designers can help. We are well-versed in the integration and manipulation of data, have the know-how to quickly transform your requirements into insightful analysis and have the creative eye to make it all come together aesthetically.
Take your business with you and make data-driven decisions from any device no matter where you are. Scale from simple spreadsheets to big data Hadoop databases, and easily combine multiple sources. The data analysis that keeps up with you. With Lancet’s Tableau expertise, you can translate pictures of data into optimized database queries. Use your natural ability to see patterns, identify trends and discover visual insights in seconds. Connect to your data and perform queries without writing a single line of code. Follow your natural train of thought as you shift between views with drag-and-drop technology. Whether you measure your data in petabytes or in billions of rows, Tableau is built to work as fast as you do. Its self-service analytics, for everyone. Get features that are intuitive and powerful with Tableau.
Visual analysis at your fingertips
Filter data dynamically, split trends across different categories or run cohort analysis. Connect to your data and perform queries without writing a single line of code.
In-depth statistics
Go deeper into your data with new calculations on existing data. Make one-click forecasts, build box plots and see statistical summaries of your data. Run trend analyses, regressions, correlations. See patterns, identify trends and discover visual insights in seconds.
Metadata management
Make better sense of your available data – quickly and easily. Rename fields and modify number formats. Combine fields into groups. Create subsets of your data by simply selecting groups of points. Use those sets to filter other views. Build new hierarchies. Now its easy for you to make your data understandable to everyone.
Best practices built in
You get the benefit of years of research on the best ways to represent data, built right into your workflow. Optimized color schemes, automatic chart types and elegant design. Communicate insight in the most effective way, automatically.
Data engine
When you want to take data offline or bring it in-memory, Tableau’s Data Engine lets you extract data for ad hoc analysis of massive data in seconds. It combines advances in database and computer graphics technology to make even huge datasets possible to analyze on a laptop or mobile device. Tap into the power of your data warehouse with up-to-date data analysis.
Tableau Mobile
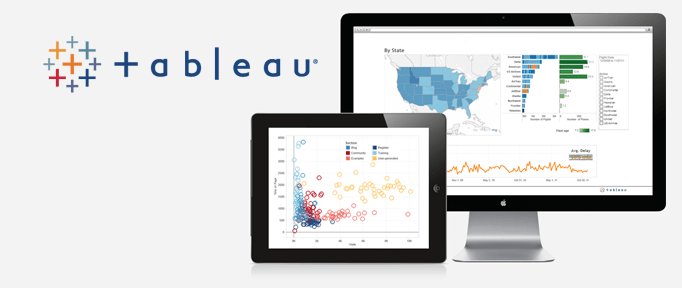
Author a dashboard once and view it anywhere, on any device. All dashboards are automatically optimized for mobile tablets without any programming. Use familiar tablet gestures to view and interact with dashboards in mobile web browsers or using native iPad and Android apps.
Tableau Managed Services |
| We are well-versed in the integration and manipulation of data, have the know-how to quickly transform your requirements into insightful analysis and have the creative eye to make it all come together aesthetically. |

